
What does it mean to be “average” in America today?
This overview takes a closer look at the everyday finances of American households to present a detailed portrait of what “typical” looks like in the United States, spanning income, debt, asset ownership, and retirement savings. While the term average refers to the statistical mean, it is used here alongside median figures to provide a more relatable point of comparison. While the figures cited come from 2022, 2023, and 2024 data, the objective is not to capture a single year, but to construct an informed approximation of Mr. Normal: a fictional representation of both the median and average American household.
Family Income
At the start of 2023, the average US household income stood at approximately $80,610, up from $53,590 in early 2013. This increase is confirmed in the latest report from the US Census Bureau[1], which provides a detailed data breakdown across demographic categories.
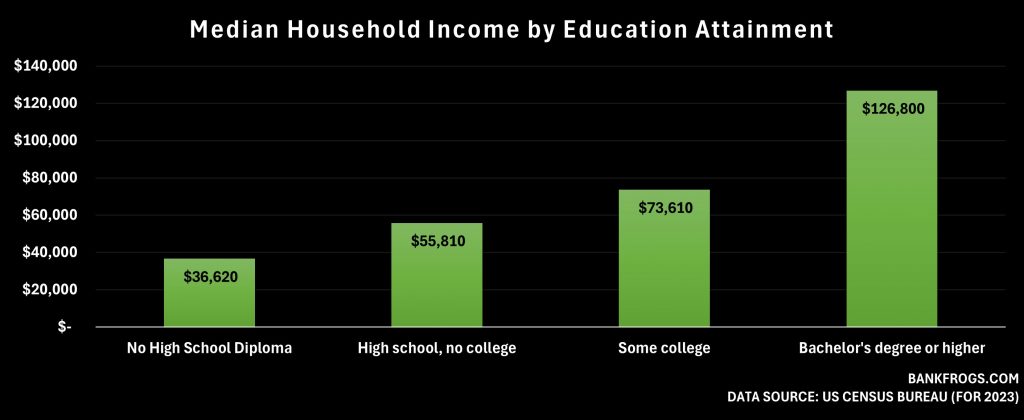
One of the most important differences appears in household income by educational attainment of the householder (age 25 and older). There is a significant income gap between those with a bachelor’s degree or higher and individuals with less education. The median family income for this group was $82,010 in 2023. On average, householders with a bachelor’s degree earn:
- 72% more than those with some college education
- 2.27x more than those with only a high school diploma
- 3.46x more than individuals without a high school diploma
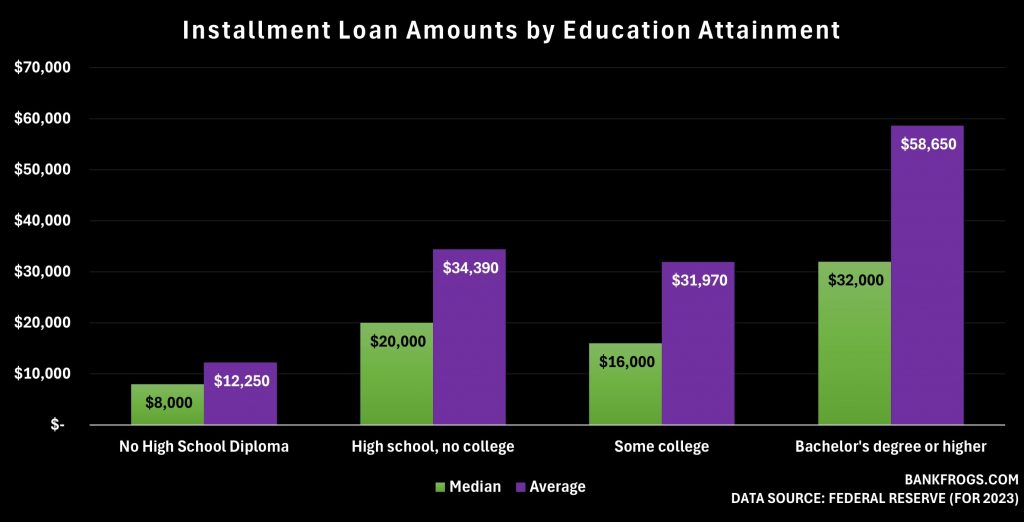
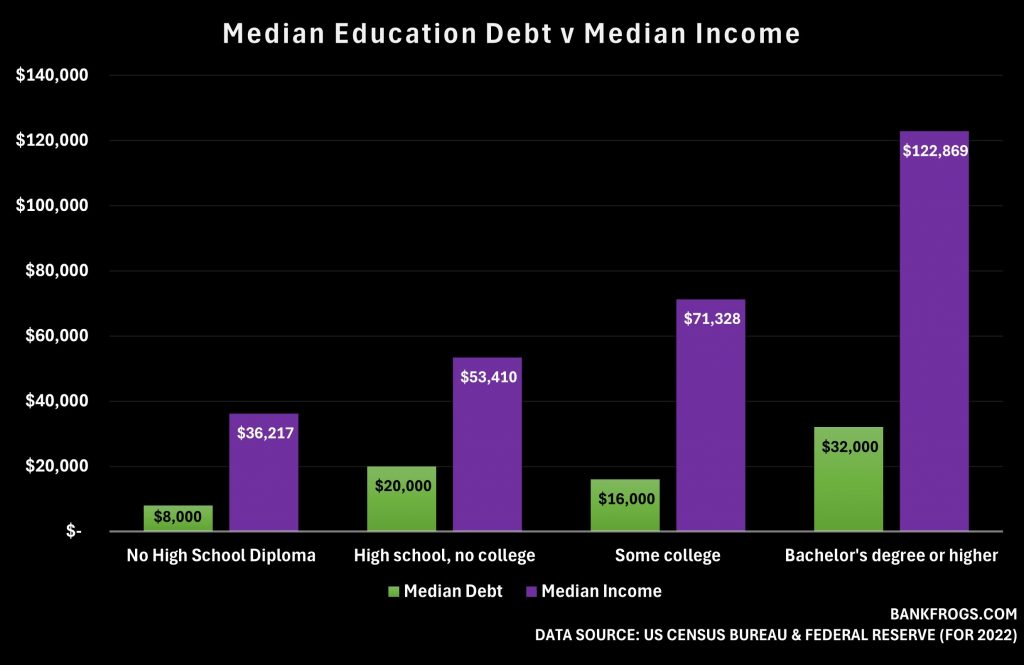
A Closer Look at Student Loans and Income
Interestingly, we can compare income data with student loan balances. According to the 2024 Experian Consumer Credit Review[2] the average student loan balance in 2024 was $35,208. While this may seem to be an important burden, data from the Federal Reserve supports the long-term payoff: higher levels of education correlate strongly with higher income. However, outcomes from trade schools are not explicitly represented in this dataset. This means a full picture of alternative educational paths remains incomplete.
Credit Card Debt: An American Essential
Credit card debt has become a major financial concern for many Americans. Consumers are increasingly relying on credit cards to cover everyday expenses.
By 2024, total credit card debt in the US surpassed $1.2 trillion[2]. On average, Americans held four credit cards each. While this may suggest overextension, this data can be misleading without proper context. Most credit card balances are paid off within 30 days, and the 30-day delinquency rate was at 3% by the end of 2024. Over the past 25 years, this rate has never reached 7%, only exceeding 6% during the 2009 financial crisis.
Mortgage Debt: The Largest Outstanding Debt
Another standout data point from the Experian 2024 report is mortgage debt, which represents by far the largest outstanding debt for most US households. Rising home prices and a growing number of buyers relying on financing have contributed to this trend. Home values have experienced a more than 50% increase in just 15 years. the median US home price increased from approx. $220,000 in 2010 to $420,000 by the end of 2024.
For most Americans, paying off a mortgage remains the single largest financial commitment over the course of their lifetime.
Growing Divide Between Income and Net Worth
Over the past two decades, median before-tax household income in the US has seen only modest growth, reaching approx. $70,000 by 2022. In contrast, the average income reached $141,000, an 18% increase. This growing gap between the median and average underscores how rising earnings are disproportionately driven by higher-income households.
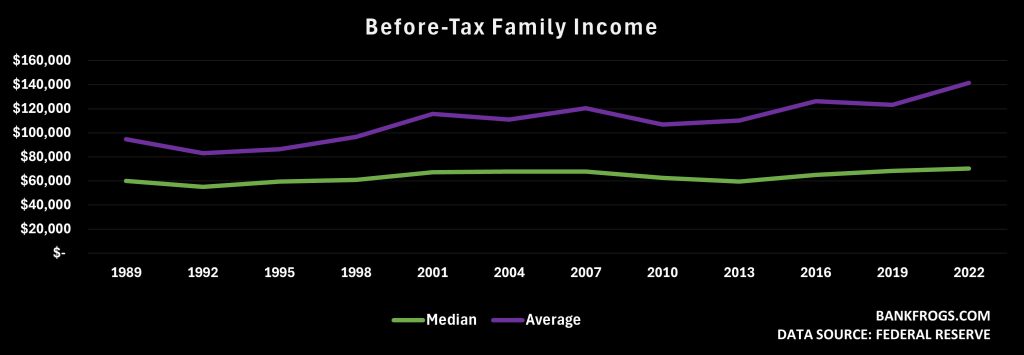
All dollar amounts are adjusted for inflation and shown in 2022 dollars.
In 2023, the Board of Governors of the Federal Reserve System published an in-depth analysis of U.S. family finances, using data collected between 2019 and 2022. While the most recent data reflects conditions as of 2022, the topic remains a priority for the Federal Reserve, with a new 2025 Survey of Consumer Finances currently underway.
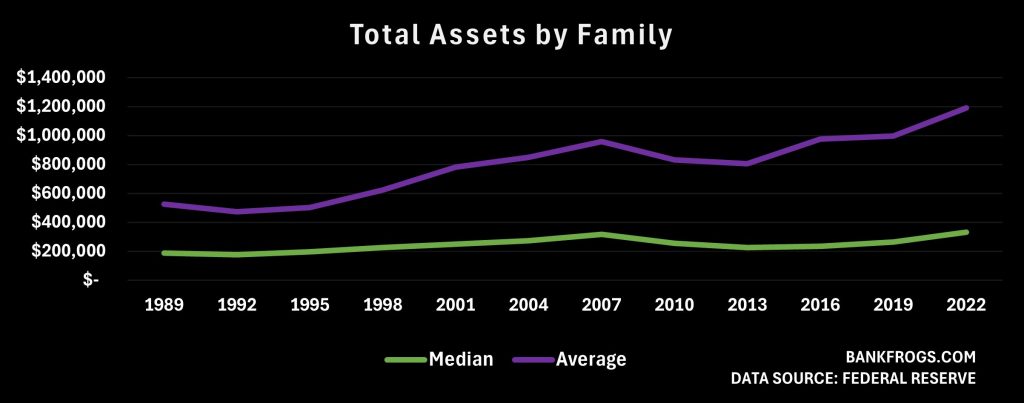
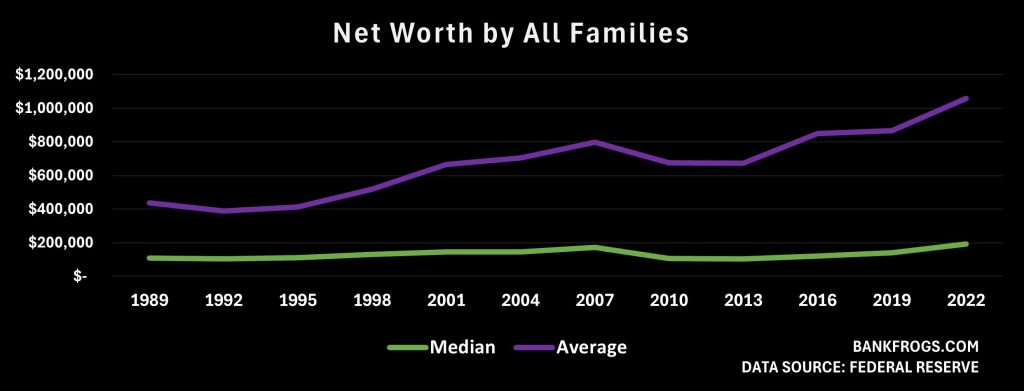
Beyond income, net worth (what families own minus what they owe) offers a more complete picture of family finances than income alone. By 2022:
- Median net worth: $192,900
- Average net worth: $1.06 million
Adjusted for inflation, since 2019 median net worth jumped by 37%, while average net worth climbed 23% to over $1 million. These gains marked the largest increase in median net worth ever recorded by the Federal Reserve’s Survey of Consumer Finances. The gap between the typical American and the national average has grown significantly in recent decades. This widening net worth divide is largely driven by the top percentile of wealthiest Americans, pushing the overall average upward.
All dollar amounts are adjusted for inflation and shown in 2022 dollars.
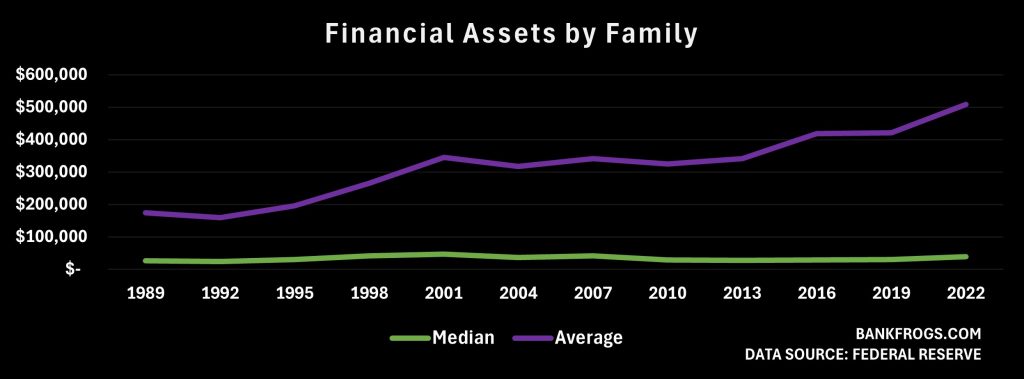
Asset Ownership
In 2022, the financial landscape of American families revealed important differences in asset ownership and value across income groups. From stocks to real estate and business ownership, wealth is still heavily concentrated at the top. The divide between typical households and the wealthiest remains wide, as reflected in the gap between median and average.
Stock Ownership and Value
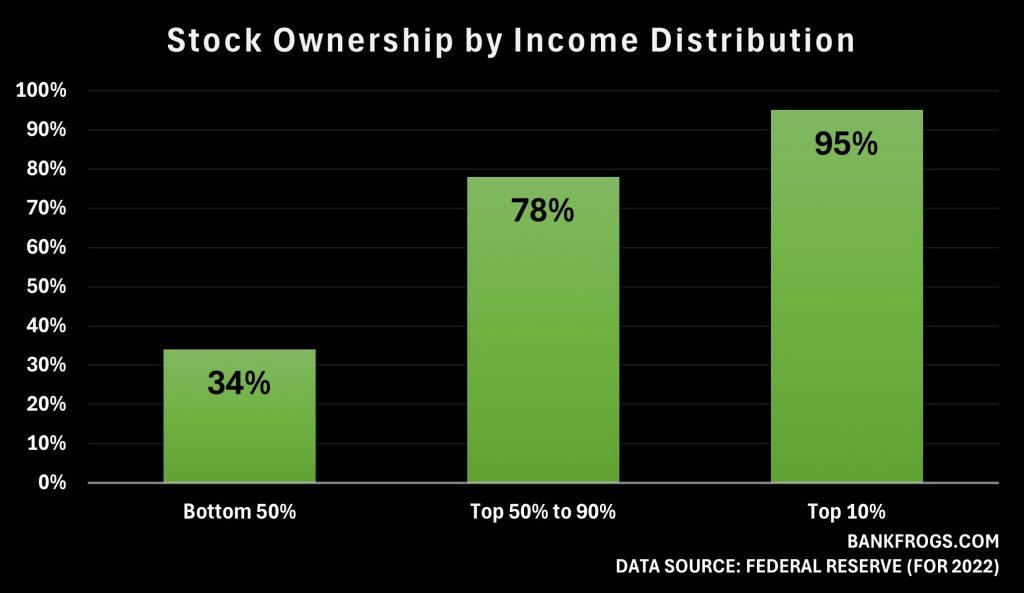
In 2022, 58% of families owned stock either directly or indirectly (through retirement accounts) [3]. However, ownership varied significantly by income:
- 34% of families in the bottom half of the income distribution held stock
- 78% in the upper-middle group
- 95% in the top 10%
Not only does participation vary, but so does the amount invested. Among families that do own stock, the median value of holdings was:
- $12,600 for the bottom half
- $53,200 for the upper-middle group
- $608,000 for the top 10%
Average values among stockholders are far higher than the median in each group, showing how a small number of households hold the majority of stock market wealth.
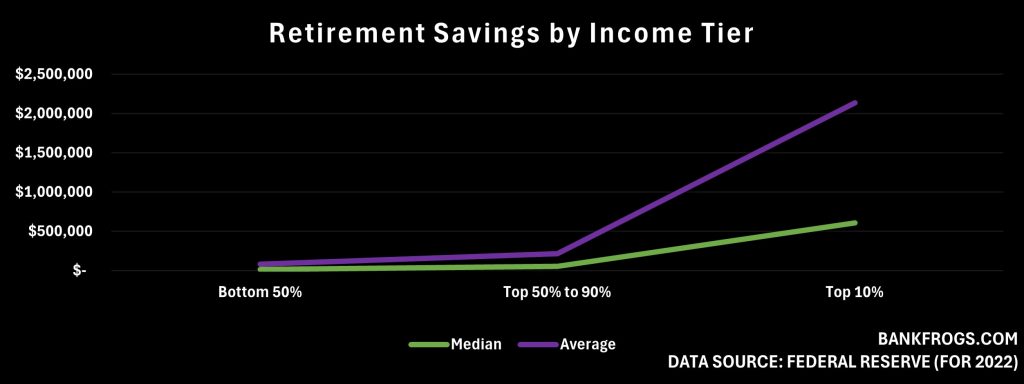
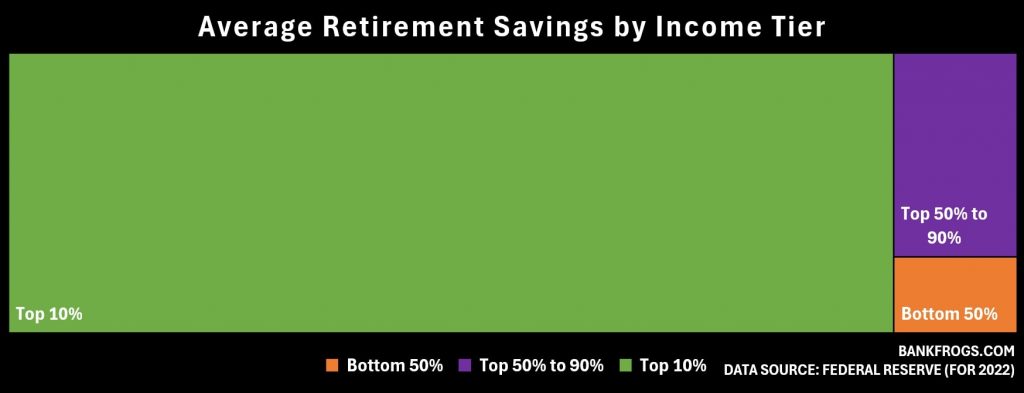
Retirement Savings
Focusing on retirement savings among families where the reference person is between ages 35 and 64 (old enough to have accumulated some wealth but not yet drawing down assets) we see clear disparities across income groups. Among families with retirement accounts, balances vary widely between the bottom 50%, the 50–90% group, and the top 10%. Retirement savings showed the following distribution:
- Families in the bottom 50% had low balances
- Middle-income families had moderate savings
- The top 10% had accumulated substantial retirement assets
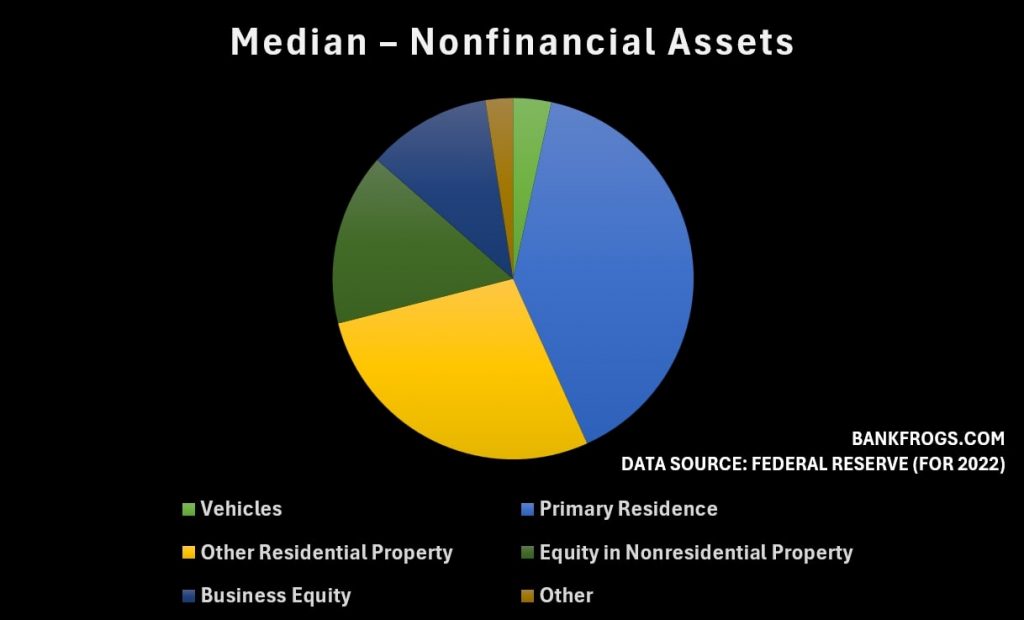
Real Estate and the Primary Residence
The largest asset of most families is their home. In 2022:
- The median value of a primary residence was $323,200
- The Average value was $471,000
About 12.9% of families owned other residential property (such as a second home or timeshare), with a median value of $225,000.
Ownership of nonresidential real estate (such as commercial property) stood at 5.9%, with a median equity of $125,000 and an average equity of $468,000.
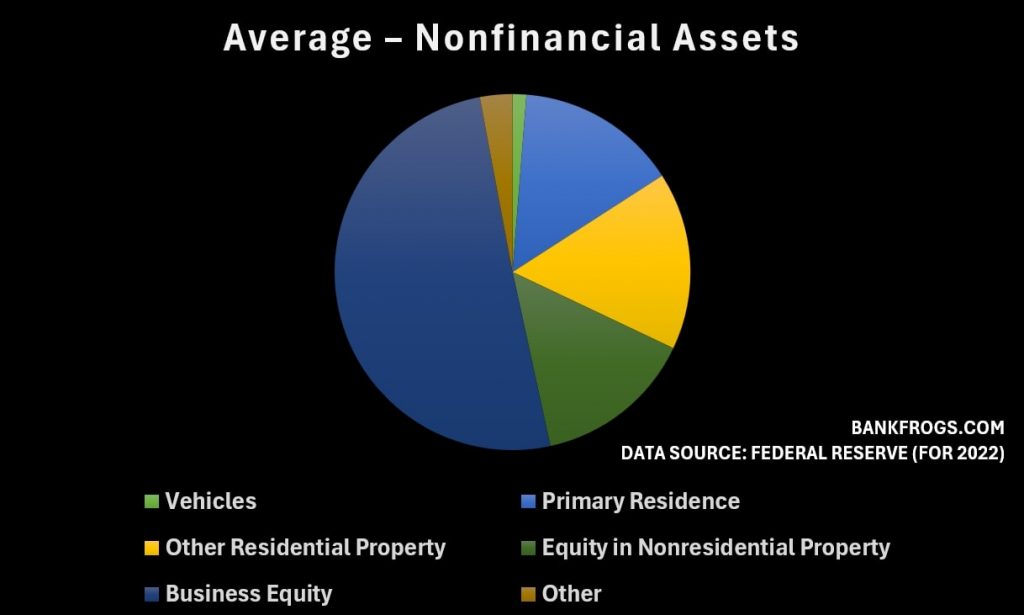
Business Equity
In 2022, 14.6% of families reported owning a private business. Among them:
- The median business equity was $90,000
- The average was an outsized $1.62 million
The disparity is largely due to a small number of privately held businesses valued in the millions, with the top percentile of families owning their wealth in their businesses.
What the Data Reveals About Mr. Normal
While national averages often capture headlines, they obscure the vast differences in financial experiences across American households. Median figures provide a more accurate sense of what is typical, while the average is largely driven by asset appreciation and income growth at the top.
Understanding Mr. Normal requires looking beyond income to include debt, net worth, and asset ownership. And in doing so, it becomes clear that the financial story of the average American is not just about what they earn, but what they own, and how far they are from the wealthiest.
Related Posts


Cover image: Suburbia (2008), by David Shankbone
References
- Guzman, Gloria, and Melissa Kollar. Income in the United States: 2023 (Current Population Reports, P60-280). U.S. Census Bureau, 2024.
- Horymski, Chris. Experian Consumer Credit Review.
Experian, 2025. - Board of Governors of the Federal Reserve System. 2022 Survey of Consumer Finances. 2023.